Environmental Research and Monitoring TeamEnvironmental Research and Monitoring Team

Tully-Murray Floodplain Monitoring

Introduction

The Environmental Research and Monitoring Team developed and deployed three types of flood water monitoring systems at 11 sites on the Tully-Murray River floodplain, near Tully in North Queensland. These systems monitor water quality and collect water samples that are used to determine sediment and nutrient loads.

Site Locations

Fifteen floodwater monitoring sites were located across the lowest part of the Tully-Murray floodplain (figure 1). Access limitations due to flooding required the installation of automated sampling systems augmented with manual sampling.

Figure 2: Three types of automated samplers were designed for floodplain monitoring: (left to right) Fully automated system with refrigertaed sampler, Temporal sampler and rising stage sampler.

Figure 1: Water quality results from the first flood event in 2007.

System Design

The most suitable device for water quality sampling is a fully automatic and refrigerated sampler. However, it is prohibitively expensive to deploy many of these across the floodplain, so a hybrid system was designed that included three automatic water quality monitoring systems that measure sediment and nutrient concentrations in over bank flood waters.

The monitoring program included one fully automated monitoring station with a refrigerated auto-sampler and telemetry, two programmable temporal water quality samplers and 8 passive rising stage samplers (figure 2).

Details of system design can be downloaded from:

http://www.clw.csiro.au/publications/science/2007/sr49_07.pdf

Results and Conclusions

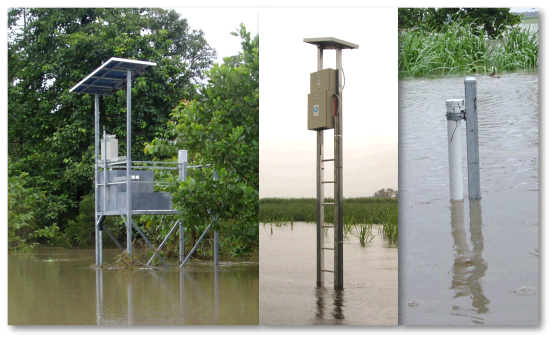
The systems operated for three years and and collected samples from 13 floods.

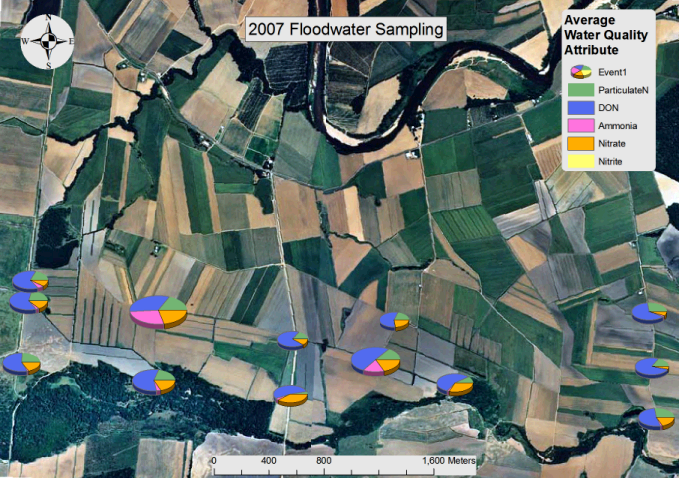
An example of the concentration data for nitrogen species at each site is shown in figure 1.

Load estimates developed from these concentration data show that flooding makes a large contribution to the marine load of sediments and nutrients that is not recorded by standard river gauges.

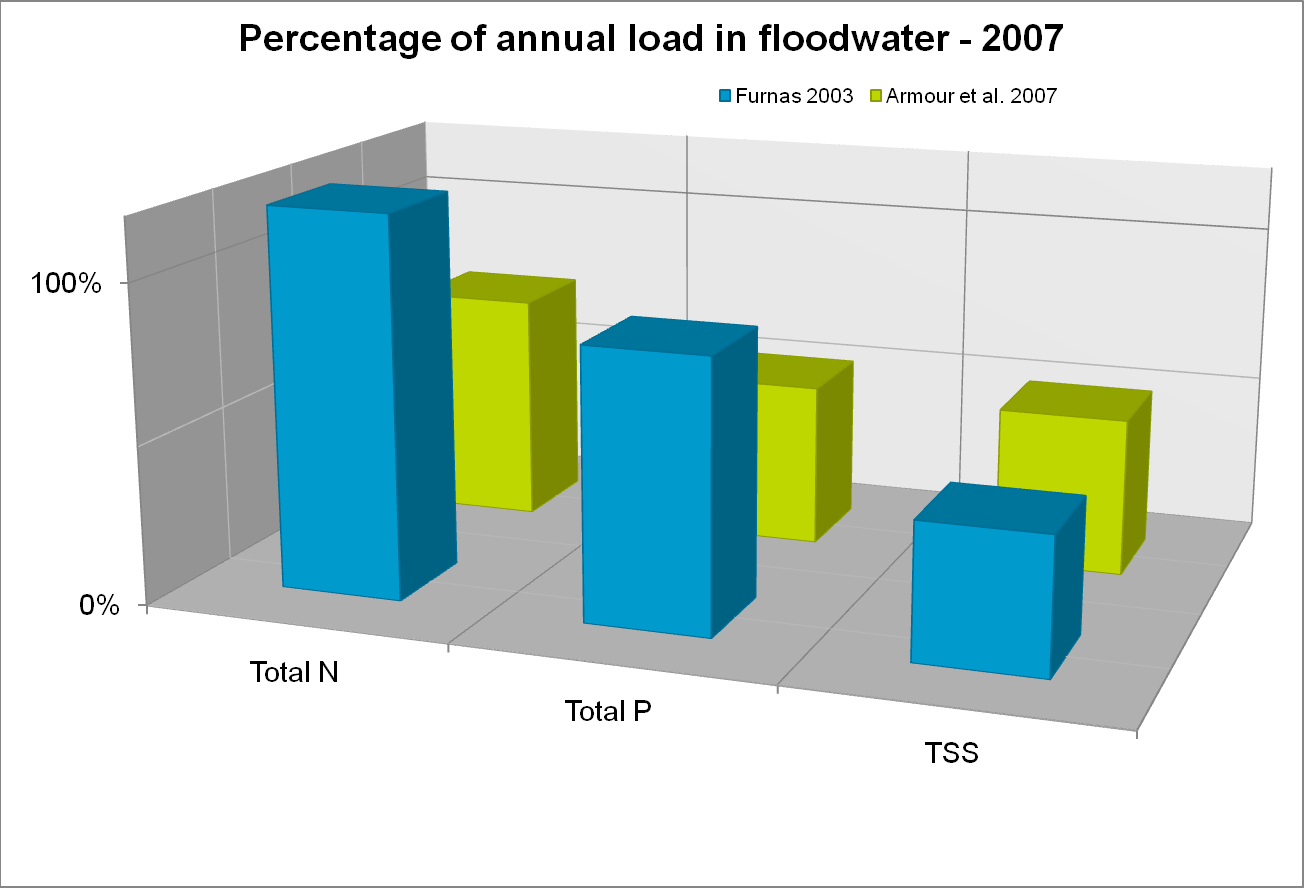
Load estimates based on stream gauges alone under-predict total nutrient export by approximately 50% for nitrogen and 30% for phosphorous (figure 3).

Figure 3: Relative contribution of 2007 floodwater to total annual loads based on standard stream gauge data.

| Legal Notice and Disclaimer | Copyright Notice | Privacy Policy |

Phone: 0747538662 - Email: Aaron.Hawdon@csiro.au